More about Weather
Viewing Plugin Weather
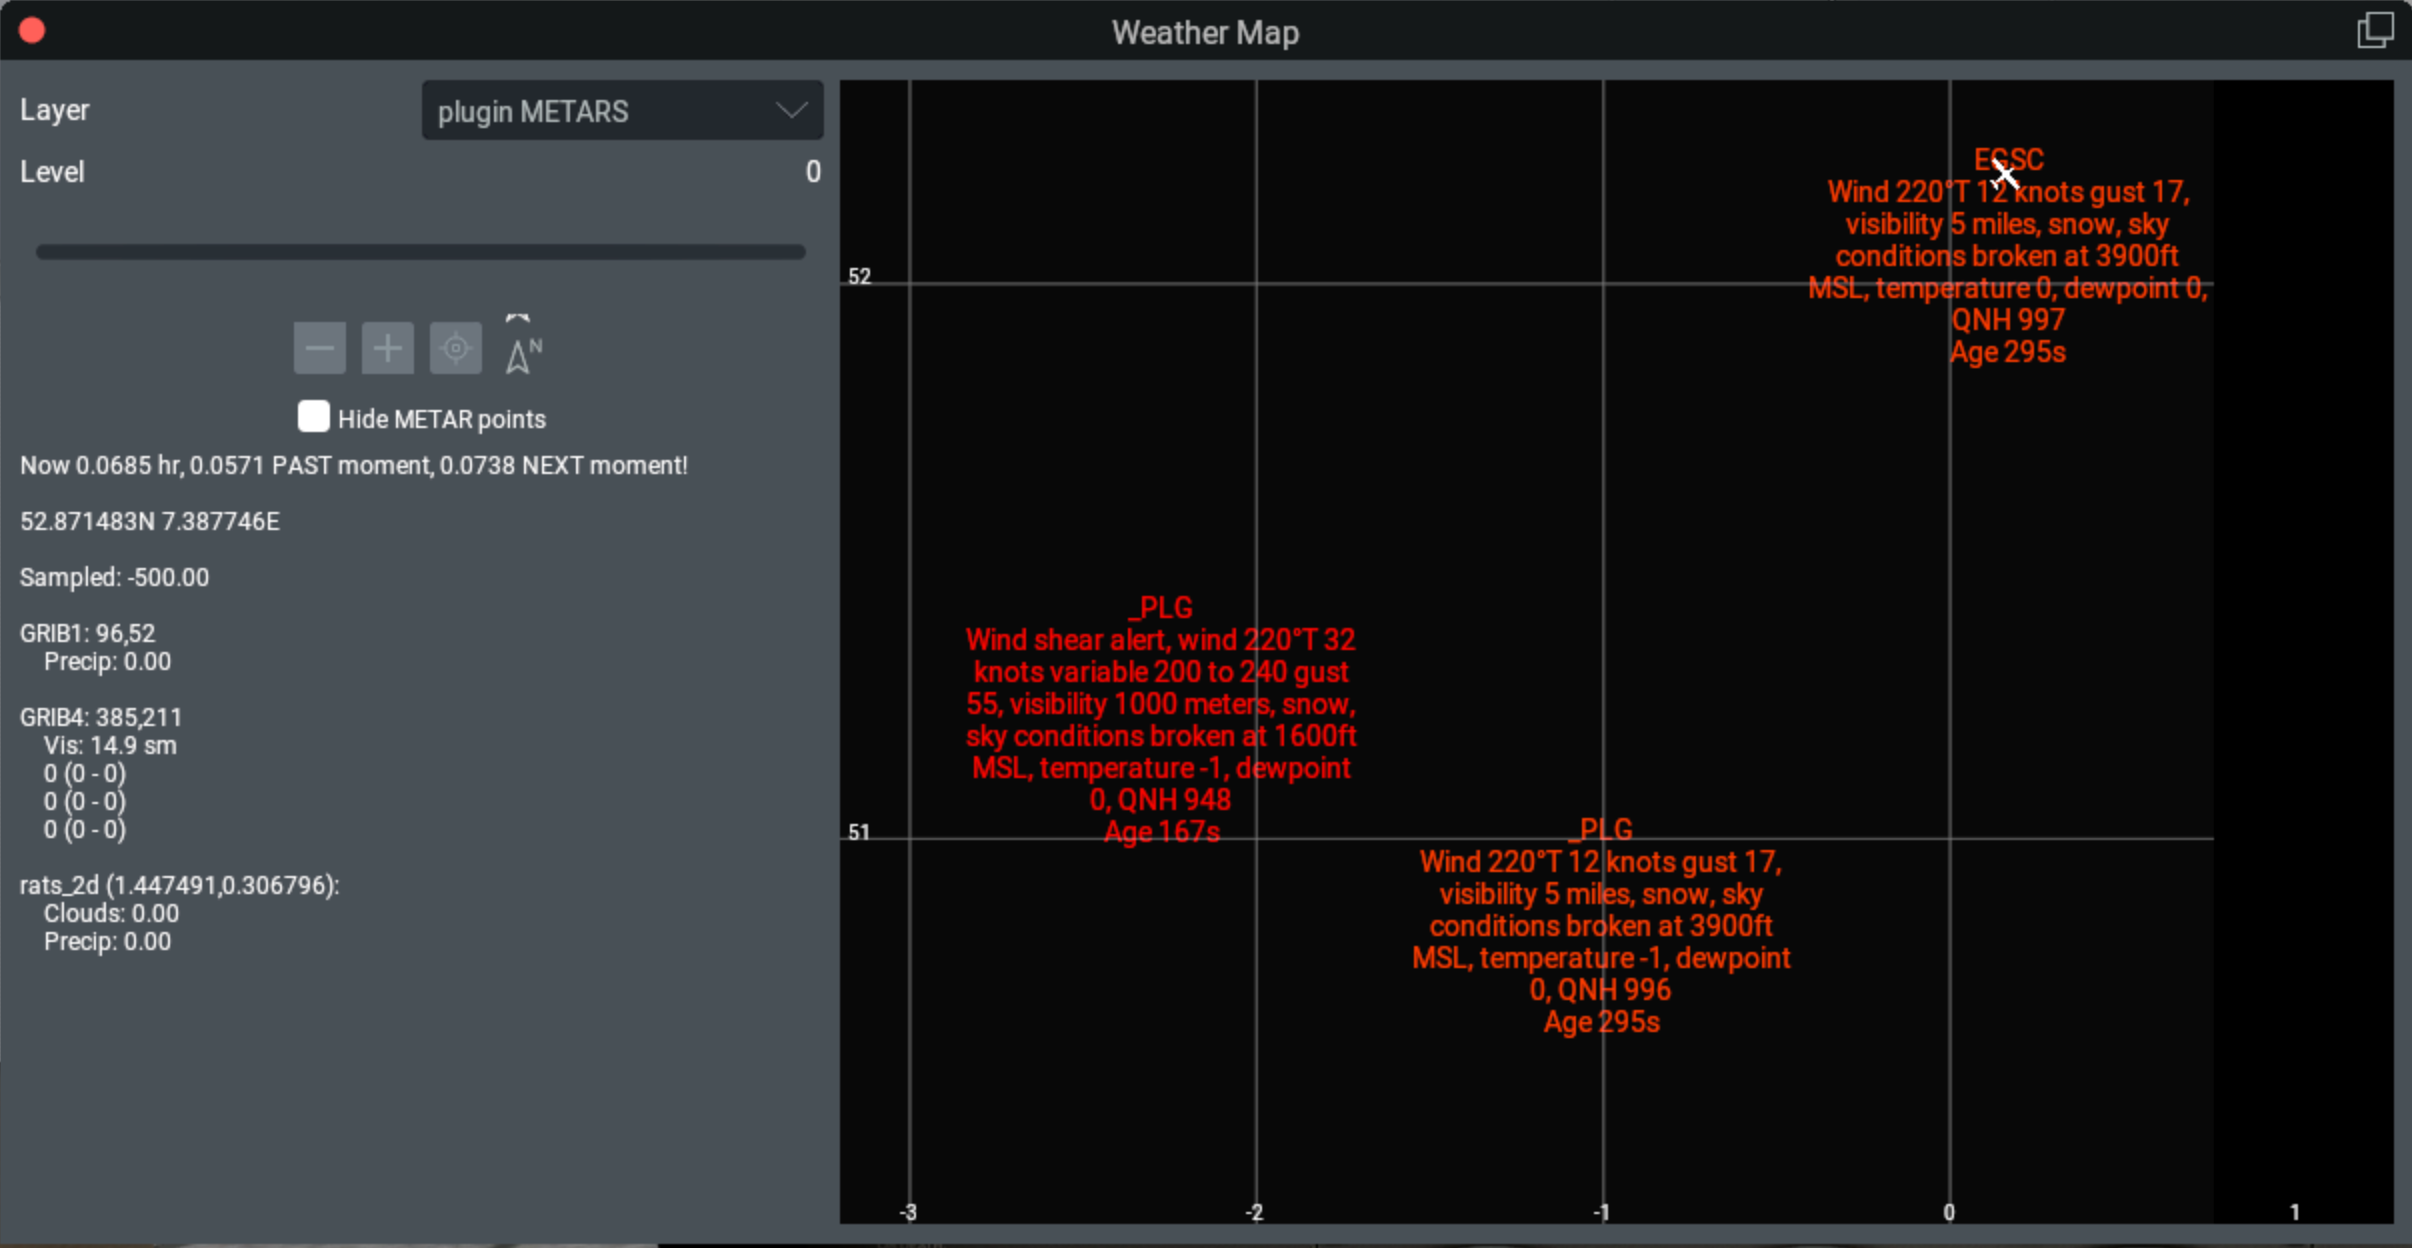
One way to visualize weather changed made by plugins is to enable the X-Plane Weather Map (Developer menu). Then select “plugin METARS” Layer. You’ll see weather that has been set by (all) plugins.
For example, in the following image, you can see weather set specifically at Cambridge airport (labeled EGSC) using setWeatherAtAirport(), and
weather set to nearby locations (labeled _PLG) using setWeatherAtLocation().
Latitude, longitude are displayed in white along the edges of the image. Note the “Age” of the report at the bottom of each.
About Temperature Layers
For a more detailed example, let’s look at how the temperature layers work. First some background:
Temperature normally decreases with altitude from sea level to the top of the troposphere (i.e., the tropopause), about 36000 ft. The decrease rate is the ‘lapse rate’ which is about 2C per thousand feet. This can vary from 1.1C (dry) to 3C (moist) due to condensation.
Above the tropopause (e.g., the Stratosphere) the temperature actually increases slowly. Generally, commercial aircraft stay below the tropopause.
X-Plane does not (appear to) model the increase in temperature above the troposphere. (Increases are normally small, so this seems a reasonable simplification.)
This example is at PMDY (Midway Airport) in the Pacific Ocean, with elevation 40’. Recall you need to be nearby to get accurate weather data, so set your favorite airplane at PMDY and try this:
>>> def ft2m(feet): return float(x) / 3.28
...
>>> info = xp.getWeatherAtLocation(28.2, -177.4, ft2m(40))
If you’ve set manual weather with clear skies, you’ll likely get ISA weather: 15°C at sea level, with near-standard lapse rate up to the top of the troposphere (i.e., the tropopause).
The relevant data we retrieve is:
>>> info.temperature_alt
14.9
>>> info.temp_layers
[15.0, 11.5, 8.6, 2.3, -4.6, -12.3, -21.2, -31.6, -44.5, -52.2, -56.5, -56.5, -56.5]
>>> m2ft(info.troposphere_alt)
36142.3
>>> info.troposphere_temp
-56.6
With better formatting:
Temperature at alt 40.0ft is 14.9°C
  [ Alt ft]    °C  (Lapse)
  [    0.0]  15.0 ( 15.0)
  [ 1771.5]  11.5 ( 11.5)
  [ 3242.2]   8.6 (  8.5)
  [ 6390.4]   2.3 (  2.2)
  [ 9875.5]  -4.6 ( -4.8)
  [13797.5] -12.3 (-12.6)
  [18276.3] -21.2 (-21.6)
  [23558.0] -31.6 (-32.1)
  [30045.3] -44.5 (-45.1)
  [33990.3] -52.2 (-53.0)
  =36142.3= -56.6 (Tropopause)
  [38990.0] -56.5 (-56.6)
  [44588.6] -56.5 (-56.6)
  [53068.4] -56.5 (-56.6)
My output function (not provided here) simply iterates through the temp_layers and altitudes, and splices in the tropopause data at the right altitude:
There are 13 temp_layers, plus the value of troposphere_alt and troposphere_temp.
The altitudes are simply the values of the
atmosphere_alt_levels_mdataref converted to feet.For comparison, I’ve included a calculated 2°C lapse rate up to the tropopause.
Temperature (and dewpoint layers) do not include altitude within this datastructure, instead, you’ll need to retrieve the float array dataref
sim/weather/region/atmosphere_alt_levels_m.
The first line “Temperature at alt” is based off of the altitude provided with xp.getWeatherAtLocation(). If I simply change the altitude
in the function calls, I’ll get the same temp_layers but a different value for temperature_alt:
>>> info = xp.getWeatherAtLocation(28.2, -177.4, ft2m(2000))
Results in data:
Temperature at alt 2000.0ft is 11.0°C
  [ Alt ft]    °C  (Lapse)
  [    0.0]  15.0 ( 15.0)
  [ 1771.5]  11.5 ( 11.5)
  [ 3242.2]   8.6 (  8.5)
  [ 6390.4]   2.3 (  2.2)
  [ 9875.5]  -4.6 ( -4.8)
  [13797.5] -12.3 (-12.6)
  [18276.3] -21.2 (-21.6)
  [23558.0] -31.6 (-32.1)
  [30045.3] -44.5 (-45.1)
  [33990.3] -52.2 (-53.0)
  =36142.3= -56.6 (Tropopause)
  [38990.0] -56.5 (-56.6)
  [44588.6] -56.5 (-56.6)
  [53068.4] -56.5 (-56.6)
Note all of the values are the same, except for the first line.
About Dewpoint Layers
Dewpoints decrease more slowly than temperatures, typically averaging closer to 0.549°C per 1000 feet. When temperature equals dewpoint, the air is saturated and the dewpoint lapse rate increases to the moist adiabatic lapse rate closer to 1.77°C per 1000 feet.
X-Plane does not specifically provide a dewpoint value at the tropopause, but the other data results are similar to temperatures.
The relevant data we retrieve is:
>>> info.dewpoint_alt
-13.2
>>> info.temp_layers
[-13.2, -14.0, -14.8, -16.4, -18.1, -20.1, -31.6, -44.5, -52.2, -56.5, -56.5, -56.5]
and:
Dewpoint at alt 40.0ft is -13.2°C
  [ Alt ft]    °C  (Lapse)
  [    0.0] -13.2 (-13.2)
  [ 1771.5] -14.0 (-14.1)
  [ 3242.2] -14.8 (-14.9)
  [ 6390.4] -16.4 (-16.7)
  [ 9875.5] -18.1 (-18.6)
  [13797.5] -20.1 (-20.7)
  [18276.3] -22.3 (-23.2)
  [23558.0] -31.6 (-26.1)
  [30045.3] -44.5 (-29.6)
  [33990.3] -52.2 (-31.8)
  =36142.3= ----- (Tropopause)
  [38990.0] -56.5 (-31.8)
  [44588.6] -56.5 (-31.8)
  [53068.4] -56.5 (-31.8)
About Setting Temperatures and Dewpoints
On set, the layers work a bit differently. If you don’t provide any layers (the default) your set will not make any change:
>>> info.temp_layers = []
You may provide some layers to override existing data. Layers not provided will be calculated from other data:
>>> info.temp_layers [14, 12, None, None, None, -15, ]
This will set the first, second and sixth layers explicitly. The other layers keep their previous values. Recall that you’ve merely provided a “report” of temperatures which adds to the mix of other existing data and will be skewed accordingly.
We extend temp_layers and dewp_layers to the full 13 values, adding None to fill out the array. Note the C-API
using any temperature value below -273.5 rather than None to signal “not provided”.
Your set can also set a value at altitude – either the airport altitude (xp.setWeatherAtAirport()) or provided with the
ground_altitude_msl value (xp.setWeatherAtLocation()). This would be the temperature_alt or dewpoint_alt values
in the data structure. Set these to None to have these values ignored on set.
By default, an instance of XPLMWeatherInfo_t is initialized with None values for temperatures and dewpoints:
>>> info = xp.XPLMWeatherInfo_t()
>>> print(info.temperature_alt, info.temp_layers)
None [None, None, None, None, None, None, None, None, None, None, None, None, None]
Caution
Don’t forget about max_altitude_msl_ft!
Layers above max_altitude_msl_ft are ignored during set. For example, let’s increase the existing temperature of each layer by 2.5 degrees:
>>> info = xp.getWeatherAtLocation(28.2, -177.4, ft2m(40))
>>> info.temp_layers = [x + 2.5 for x in info.temp_layers]
By default, max_altitude_msl_ft is 10000 ft, so the changes are
applied only below 10000ft. Compare before/after set below, noting
the first few temperatures are raised, but after 10,000 feet, temperatures
remain unaffected:
Temperature at alt 40.0ft is 14.9°C
  [ Alt ft]    °C
  [    0.0]  15.0
  [ 1771.5]  11.5
  [ 3242.2]   8.6
  [ 6390.4]   2.3
  [ 9875.5]  -4.6
  [13797.5] -12.3
  [18276.3] -21.2
  [23558.0] -31.6
  [30045.3] -44.5
  [33990.3] -52.2
  =36142.3= -53.0
  [38990.0] -56.5
  [44588.6] -56.5
  [53068.4] -56.5

Temperature at alt 40.0ft is 17.4°C
  [ Alt ft]    °C (Diff)
  [    0.0]  17.5 (+2.5)
  [ 1771.5]  13.8 (+2.3)
  [ 3242.2]  10.6 (+2.0)
  [ 6390.4]   3.8 (+1.5)
  [ 9875.5]  -4.3 (+0.3)
  [13797.5] -12.3
  [18276.3] -21.2
  [23558.0] -31.6
  [30045.3] -44.5
  [33990.3] -52.2
  =36142.3= -50.5 (+2.5)
  [38990.0] -56.5
  [44588.6] -56.5
  [53068.4] -56.5
Note the tropopause temperature is also increased by 2.5 degrees. My guess is this is likely a bug.
About Cloud Layers
X-Plane supports up to three cloud layers, as reported by the cloud_layers attribute:
>>> info = xp.getWeatherAtLocation(28.2, -177.4, ft2m(40))
>>> for layer in info.cloud_layers:
...    print(layer.coverage, layer.alt_base, layer.alt_top)
...
0.404 1004.1 4331.6
0.193 1163.1 1663.0
0.0   7315.2 8534.4
Or, with better formatting (and converting altitudes from meters to feet):
Clouds:
    [Base - Top ft] [Type (code)]
   3289.6 - 14204.8  Scattered Cumulus ( 40% type: 2.0)
   3815.2 -  5454.8        Few Cumulus ( 19% type: 2.0)
Recognize that when coverage is 0.0, you should ignore the layer data. It appears the lowest base is in the first layer, but this may just be a coincidence. Layers may overlap.
The cloud type is given as a float which you can interpret more like a gradient than a strict enumeration:
0 = Cirrus1 = Stratus2 = Cumulus3 = Cumulonimbus
Therefore cloud_type = 2.2 should be interpreted as “Cumulus - Cumulonimbus”.
When you set layers, set coverage to zero to ignore the layer setting (that is, you only want to specify two layers). That will remove the layer. There is no way to say “update weather, but keep clouds to whatever they are”. The best you can do is retrieve current cloud_layers and then use that with the set command.:
>>> info = xp.getWeatherAtLocation(28.2, -177.4, ft2m(40))
>>> # ... make changes to temperature, leaving clouds unchanged...
>>> with xp.weatherUpdateContext(isIncremental=0, updateImmediately=1):
...   # Make sure to reset max_altitude_msl_ft and radius_nm for your temp changes
...   info.max_altitude_msl_ft = xp.DefaultWxrLimitMslFt
...   info.radius_nm = xp.DefaultWxrRadiusNm):
...   xp.setWeatherAtLocation((28.2, -177.4, ft2m(40), info)
Unlike temperature layers, cloud layer data is used regardless of the value of max_altitude_msl_ft.
About Wind Layers
Wind layers, unlike temperature layers, include their altitudes in meters. The depth of the wind layer is not defined. If the given speed is less than zero, the layer is undefined and should be ignored. Otherwise, the speed is given in meters per second (double that to approximate knots).:
Winds:
  [ Alt ft]   Wind
  [    0.0]   8@145
  [ 1771.5]  18@134
  [ 3242.2]  20@148
  [ 6390.4]  24@172
  [ 9875.5]  24@186
  [13797.5]  24@199
  [18276.3]  46@214
  [23558.0]  78@213
  [30045.3]  89@214
  [33990.3]  97@214
  [38990.0]  77@219
  [44588.6]  67@223
  [53068.4]  38@209
(Yes, these altitudes appear to match altitudes from the dataref, but that’s not guaranteed.)
Wind gust is specified per layer. The value here is the total speed (average speed + extra for gust) rather than just the incremental gust speed. X-Plane will always provide a floating point value which may be very close to the speed (e.g., speed is 15.2 knots, gust is 15.4 knots). Normally gusts are reported only when they exceed 5 meters/second over speed.
Shear is also reported per layer. Though “wind shear” is usually reported as apparent change in wind speed, in this case, its reporting variability of wind direction. The value is in degrees and represents an arc of variability centered on the wind direction. Therefore an easterly wind direction of 90° with shear value of 45° means the wind direction varies ±22.5° or from 67.5° to 112.5°. This is not commonly reported unless the variability is more than 45°.
About Barometric Pressure
[to be provided]